APMG
Turning a certification maze into a guided, confident journey
Process
- 01Research
- 02Define
- 03Design
- 04Test
Research
The research phase set out to understand how different user groups move through APMG’s certification and accreditation offering, and where that journey breaks down. It combined quantitative data with qualitative research to build a clear picture of real user needs before any design work began.
How to improve the design:
- Intuitive navigation: regardless of the level of specialisation, the site must be intuitive and easy to use for all user groups.
- User trust: based on APMG’s work history, the company needs to provide a list of partners (or people who received an excellent offer after certification or accreditation).
- Accessibility: users may have different limitations, so it is vital to ensure compliance with WCAG.
What was included in the UX analysis
Quantitative analysis
- Google Analytics
- Survey analysis
- Stakeholders’ interviews
Qualitative analysis
- Research
- Competitive benchmarking
- Usability testing
- Empathy map
- Customer journey map
How the analysis findings informed the design:
Competitive benchmark
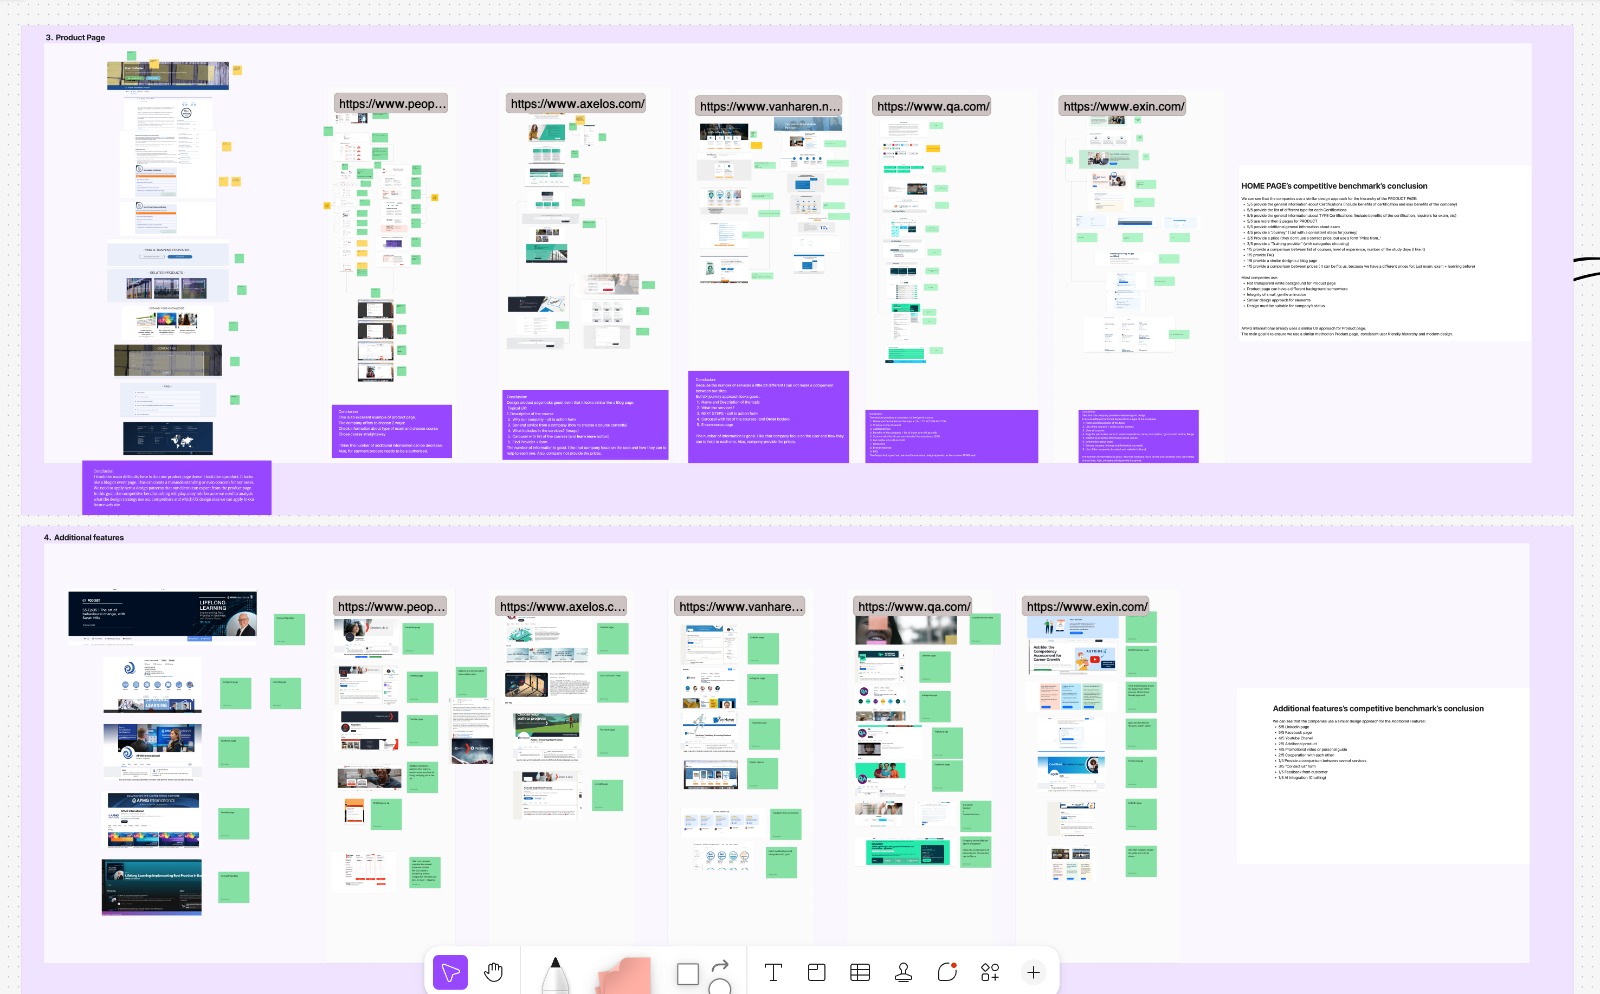
Main goals of the competitive benchmark:
- Find out which design trends are popular.
- Assess competitors’ design quality to see where improvements can be made.
- Examine how competitors present their brand to identify features.
- Look at competitors’ innovative design approaches for inspiration.
- Compare competitors’ user experience to make our product more user-friendly.
- Make sure the designs are usable by people with diverse abilities.
- Understand how competitors use design patterns.
Empathy map
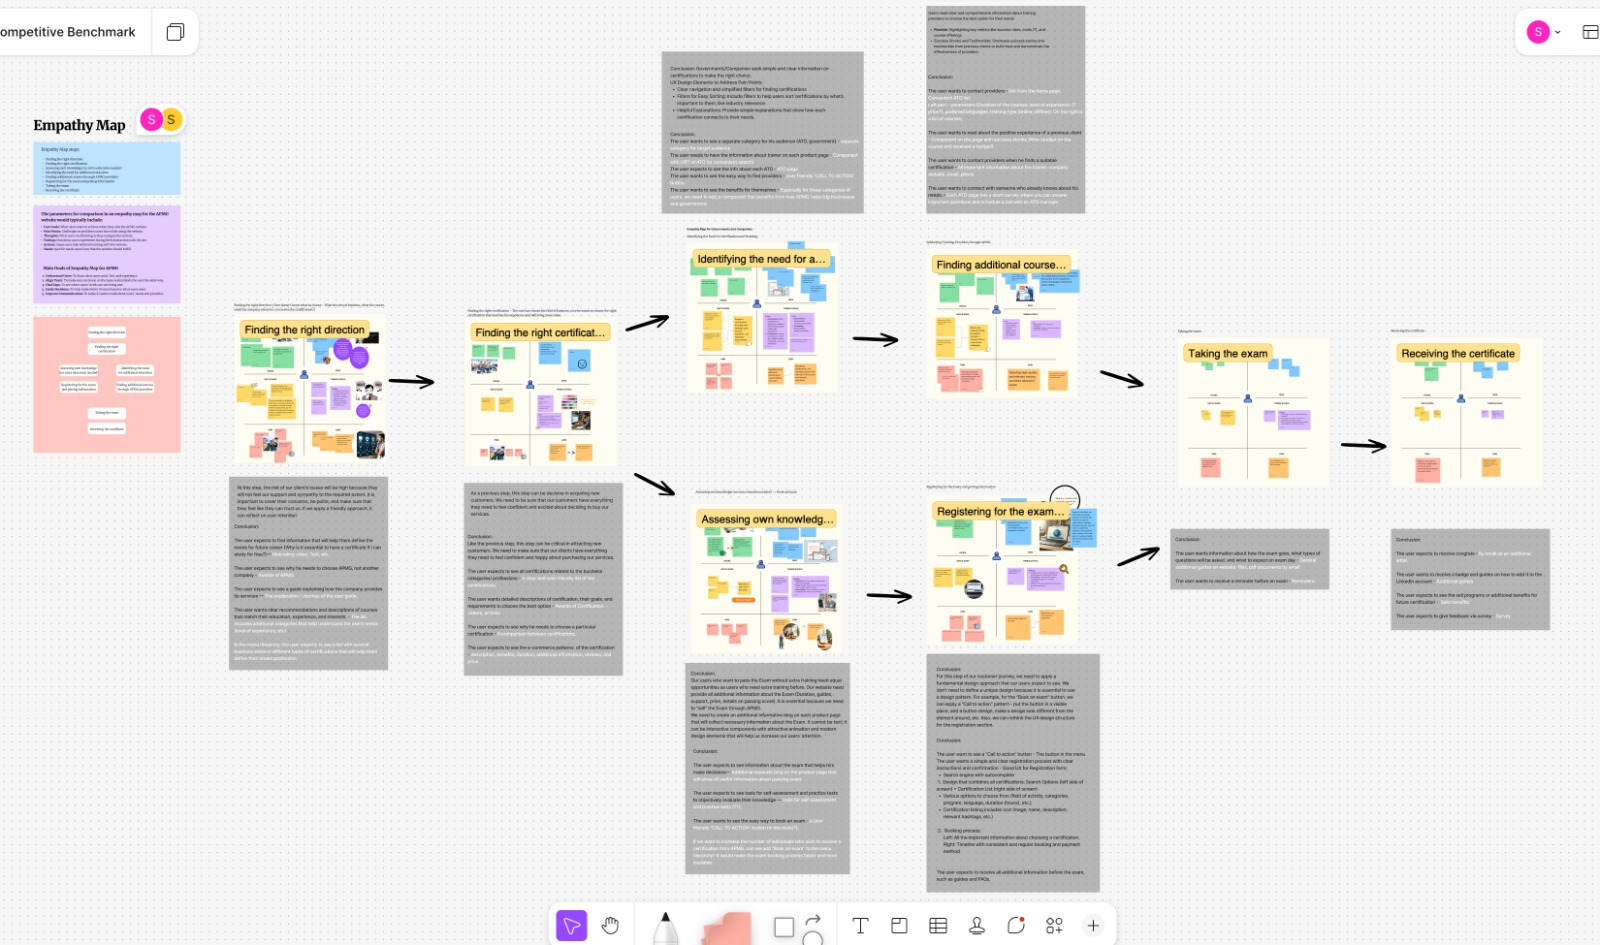
Empathy map journey for the APMG user:
- Guiding users towards the right path through relevant business categories.
- Finding the right certification.
- Assessing their own knowledge (no extra education needed) or identifying the need for additional education.
- Finding additional courses through APMG providers.
- Registering for the exam and getting information.
- Taking the exam.
- Receiving the certificate.
Main goals of the empathy map for APMG:
- To learn what users need, feel and experience.
- To make sure everyone on the team understands the user the same way.
- To see where users’ needs are not being met.
- To help make better choices based on what users want.
Customer journey map
Main goals of the customer journey map for APMG:
- Identify key user touchpoints across the certification and training journey.
- Reveal pain points, drop-off moments and sources of user confusion.
- Understand user emotions, needs and motivations at each stage.
- Highlight gaps in information, guidance and decision support.
- Improve navigation and simplify the path to key actions (e.g. booking, enrolling).
- Align user goals with APMG’s business objectives and conversion targets.
Define
The Define phase brought the research together to pinpoint exactly where users struggle and why, turning scattered findings into a clear set of problems to solve.
Across usability testing, the CJM, empathy mapping and quantitative analysis, a consistent pattern of friction emerged in the APMG experience. Users struggle most with decision-making due to unclear pathways, fragmented information and a lack of guidance, which leads to uncertainty and drop-offs. Quantitative data reinforces this, showing reduced engagement at key decision points such as course selection and booking. Combined with the qualitative insights, it is clear that trust signals are weak, navigation is overly complex, and the platform does not sufficiently support different user needs or experience levels.
These findings highlight critical weak spots in clarity, guidance and conversion flow that must be addressed before prototyping.
Design
The Design phase translated those findings into a working solution, moving from user flows and low-fidelity prototypes through to a refreshed, high-fidelity interface.
- Prototyping
- User flow
- Low-fidelity prototyping / testing
- High-fidelity prototyping / testing
- Applying animation
- Testing / adjusting
Prototyping
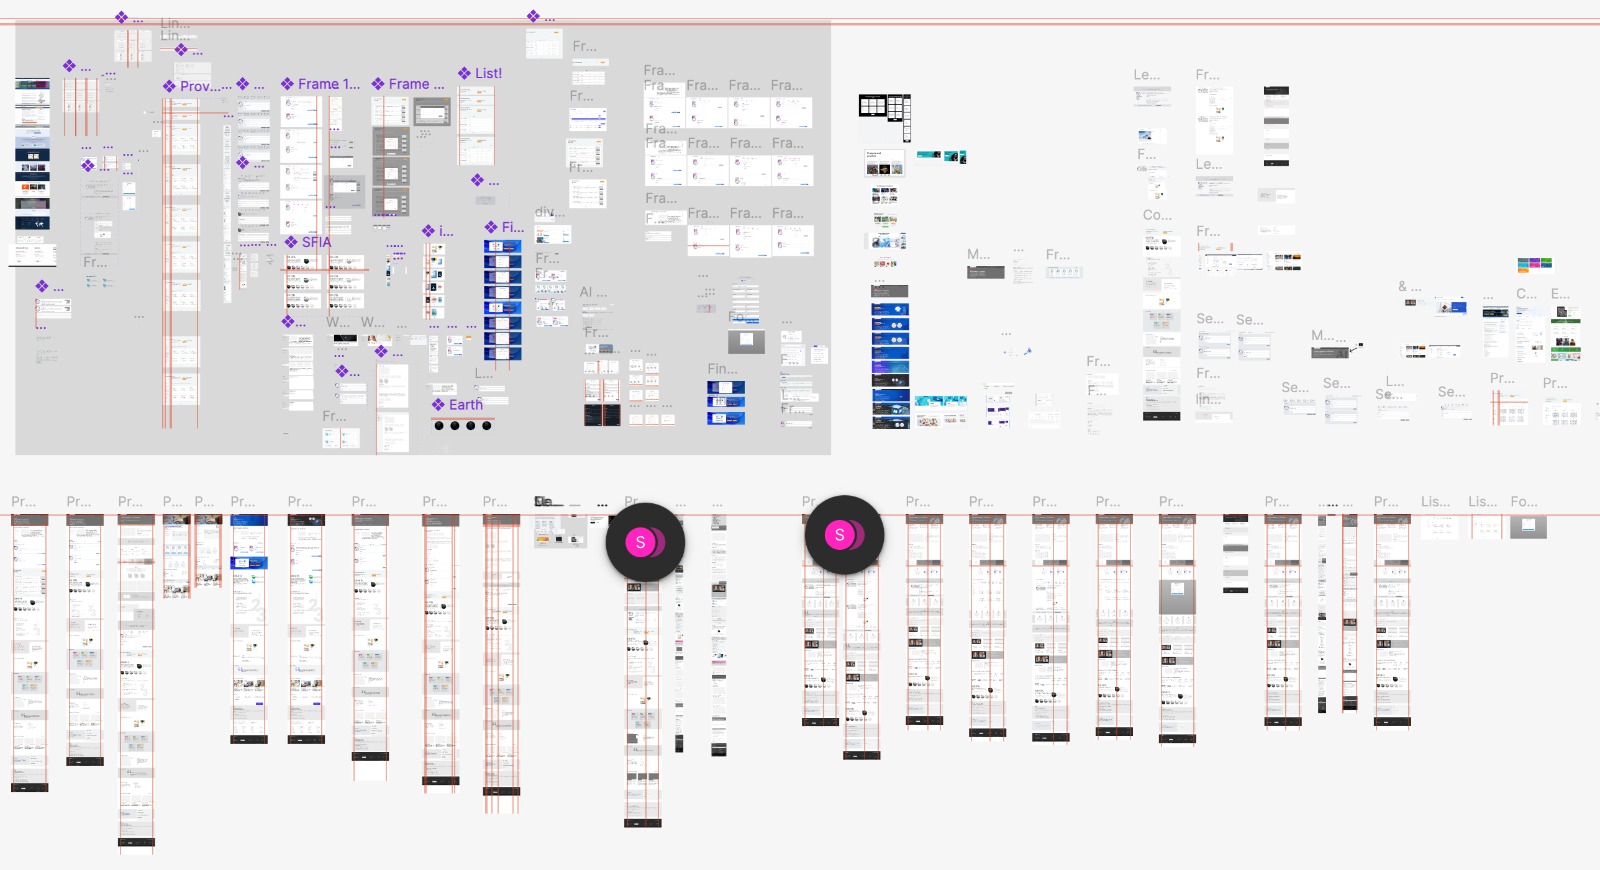
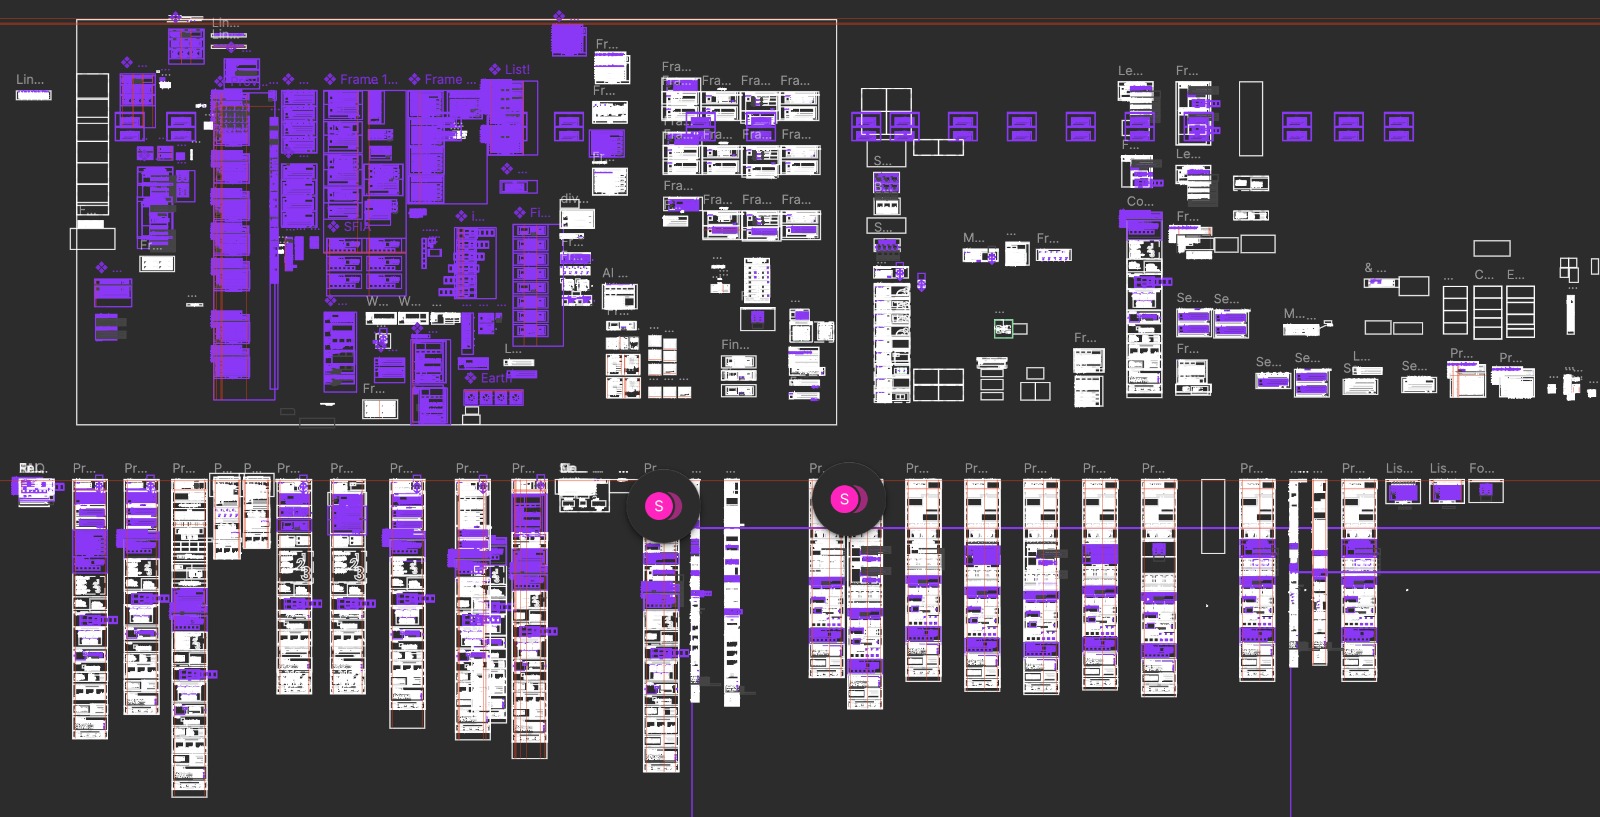
The prototype was created using insights from the research and analysis, including usability testing, the CJM, empathy mapping and quantitative data. These findings guided the design decisions and helped address the main user pain points. The screenshot highlights the Figma component outlines, demonstrating the reusable UI components that ensure consistency and scalability throughout the interface.
UI design
Steps:
- UI research
- Creating the brand book
- Creating web libraries
- UI prototyping
- Testing / adjusting
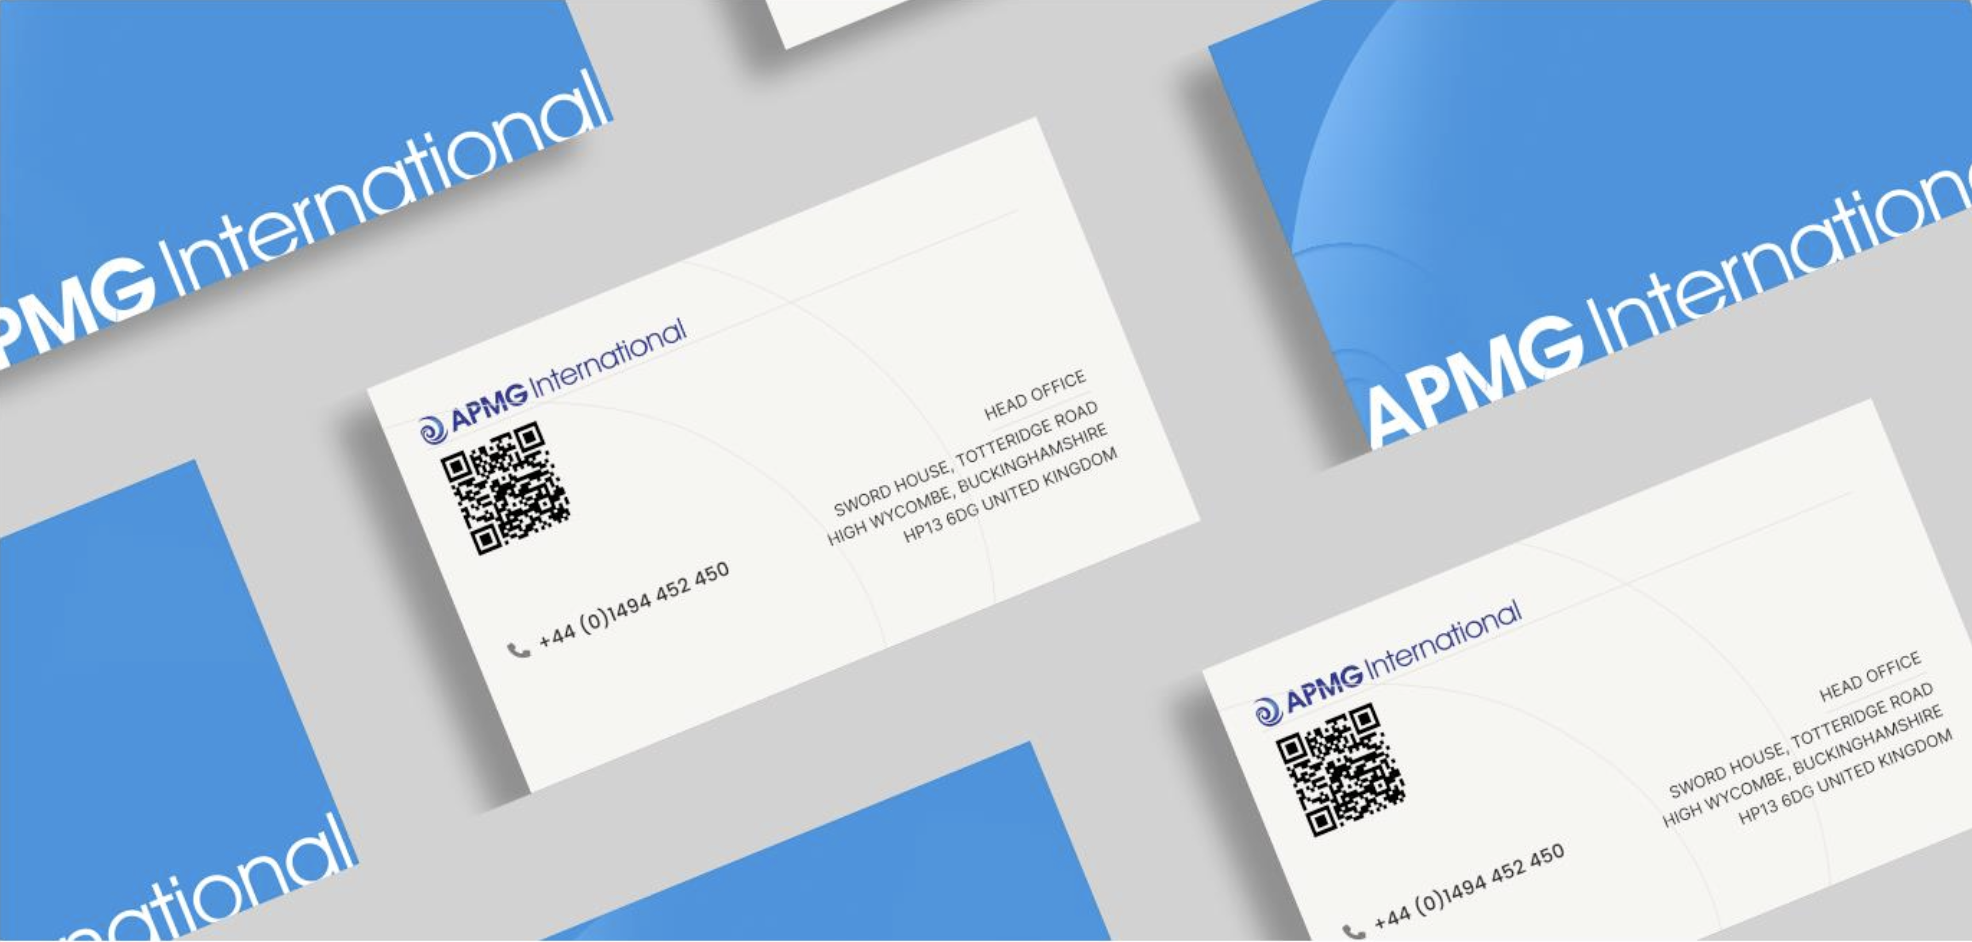
For APMG, a new brand book was created. A demonstration of the brand book can be shown on request.
Test
Testing ran throughout the design phase, with each prototype checked against real user tasks so that navigation, clarity and the platform’s trust signals could be refined before hand-off.